滨海湿地为包括人类在内的众多生物提供了宝贵的生态系统服务功能,然而这一重要的生态系统正日益受到人为活动的威胁。自工业革命以来,大气中的二氧化碳(CO2)浓度从280 ppm增加到410 ppm,预计到2100年将超过900 ppm。在陆地生态系统中,CO2浓度的上升通常会促进C3植物的光合作用和初级生产力,从而导致植物形态的变化。但是,与木本植物或农作物相比,非木本克隆植物对CO2升高的形态响应模式却鲜有研究。考虑到绝大多数盐沼植被都是克隆植物,且其形态变化将直接决定滨海湿地生态系统的结构和功能,卢蒙博士及合作者在位于美国东海岸Chesapeake Bay的盐沼湿地开展了30余年的CO2倍增实验并测量了超过20万株的植物形态数据,以探讨全球变化背景下盐沼湿地植物形态变化对生态系统结构和功能的影响。
项目组研究表明,30年的倍增CO2控制实验提高了盐沼湿地生态系统初级生产力和植被的密度,但降低了优势克隆物种Schoenoplectus americanus的茎秆直径和高度(Fig. 1)。较小,较密的茎秆与根和根状茎的扩张有关,以减轻CO2倍增条件下导致的氮(N)限制,这一点可由茎秆、细根、根状茎和凋落物中升高的N含量,增加的植物组织碳氮比(C:N ratio),和降低的土壤孔隙水无机氮含量所证明(Fig. 2a)。在另一组倍增CO2和氮添加(CO2 + N)控制实验中,Schoenoplectus americanus的形态变化得到反转,即茎秆直径和高度同时增加(Fig. 2b)。因此我们得出,土壤有效氮是控制植物形态对CO2浓度变化响应的关键因子(Fig. 3)。
同时,项目组根据盐沼植被形态学和生物量的变化,模型模拟了未来气候变化和海平面上升情景下滨海湿地生态系统土壤沉积物的积聚响应模式,结果表明CO2和N的交互作用能促进盐沼湿地的抬升(Table 1),从而为滨海湿地生态系统应对海平面上升提供有力的保障。
该研究成果发表在最新一期的《Nature Climate Change》杂志。
全文链接:
https://www.nature.com/articles/s41558-019-0582-x
DOI:https://doi.org/10.1038/s41558-019-0582-x
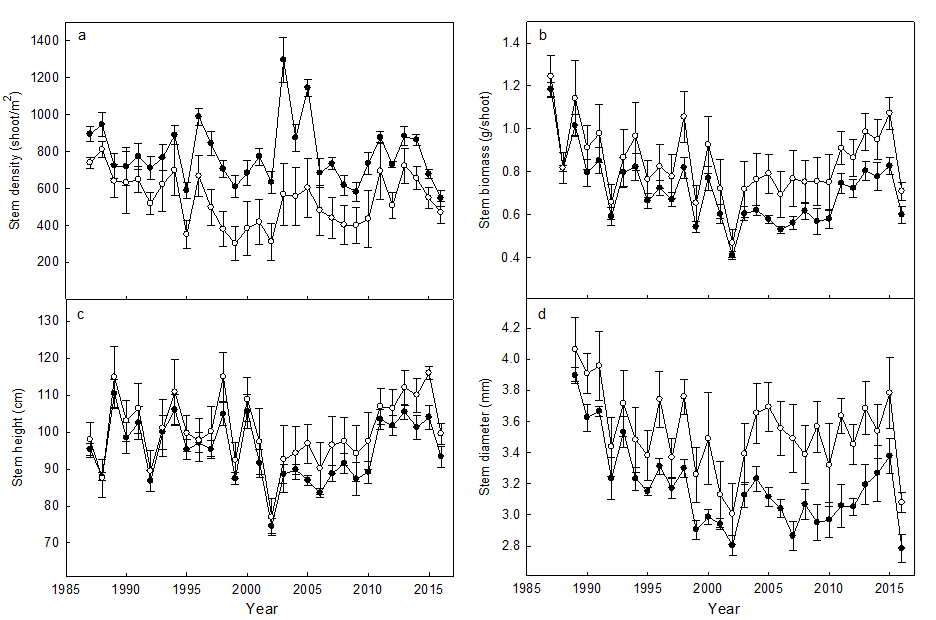
Fig. 1 Elevated CO2 responses of individual stem of S. americanus in the C3 community of Experiment 1 from 1987 to 2016. The mean ± s.e.m. (n=5 replicate plots) of stem density (a), stem biomass (b), stem height (c), and stem diameter (d) are shown separately for ambient CO2 (open circles) and elevated CO2 chambers (filled circles).
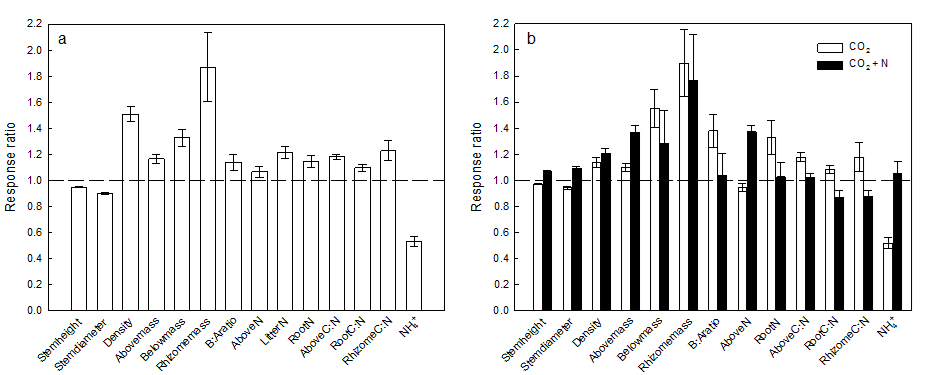
Fig. 2 The response ratios of key parameters from the two experiments. Elevated CO2 caused symptoms of N limitation such as increased root:shoot ratio and lower available soil N, effects that were mitigated by N addition. Each bar (elevated CO2: open bars, elevated CO2 plus N addition: filled bars) is the mean (± s.e.m.) response ratio (Elevated/Ambient) in Experiment 1 (a) and Experiment 2 (b) across all years in the record.
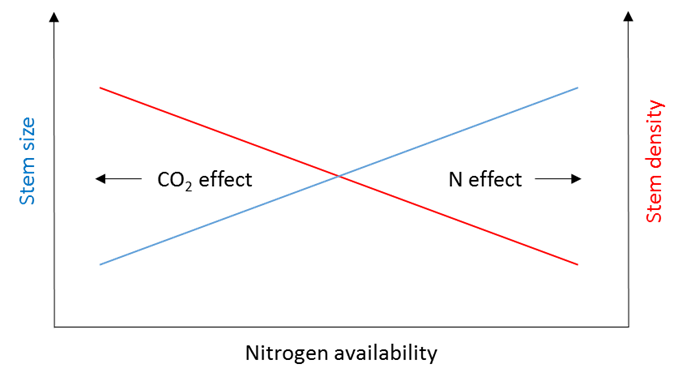
Fig. 3 A conceptual framework for the responses of clonal plant aboveground growth pattern to CO2 enrichment and nitrogen availability.
Table 1. Impacts of elevated CO2 and N on plant growth and accretion. Mean values for frontal area per unit volume (m-1), belowground organic accretion (mm yr-1, from Pastore et al. 2017), total belowground productivity (g m-2 yr-1), stem density (shoot m-2), aboveground biomass (g m-2), and modeled aboveground mineral accretion (mm yr-1) for Experiments 1 and 2. Means ± s.e.m. with the same letter in the same column and experiment are not significantly different from one another (A, B for Experiments 1 and a, b, c for Experiments 2).
|
Frontal Area |
Measured Belowground Organic Accretion* |
Belowground productivity |
Stem density |
Aboveground Biomass |
Modeled Aboveground Mineral Accretion |
Experiment 1 |
|
|
|
|
|
|
Ambient |
2.2 (0.2)A |
N/A |
269 (21) |
538 (25) |
497 (33) |
4.5 (0.1)A |
CO2 |
2.4 (0.2)B |
N/A |
349 (28) |
784 (30) |
564 (33) |
5.7 (0.1)B |
Experiment 2 |
|
|
|
|
|
|
Ambient |
2.4 (0.2)a |
0.46 (0.3) |
143 (23) |
527 (23) |
587 (52) |
4.2 (0.1)a |
CO2 |
2.6 (0.2)a,b |
1.84 (0.4) |
228 (25) |
598 (30) |
645 (66) |
4.9 (0.1)b |
CO2+N |
3.2 (0.3)b |
1.70 (0.6) |
187 (35) |
633 (31) |
803 (83) |
5.7 (0.1)c |
N |
2.3 (0.2)a |
1.81 (0.5) |
110 (15) |
503 (28) |
555 (60) |
4.4 (0.1)a |